

Role:
HCI Researcher acting on end user interviews, focus groups, field studies, and visual analytics developer.
HCI Researcher acting on end user interviews, focus groups, field studies, and visual analytics developer.
Collaborations:
Collaborating with designer, engineers, and researchers.
Collaborating with designer, engineers, and researchers.
Skills:
User-Centered Design, visual analytics design/development using D3, and eye tracking.
User-Centered Design, visual analytics design/development using D3, and eye tracking.
End-to-end process:
Interviews, Focus groups, Requirements elicitation, Prototyping, Development, Deployment, and Eye Tracking Evaluation.
Interviews, Focus groups, Requirements elicitation, Prototyping, Development, Deployment, and Eye Tracking Evaluation.
Industry/sector:
Finance.
Finance.
Research problem:
How to support GRC (Governance, Risk, Compliance) experts on identifying data inconsistencies, errors, and patterns considering key characteristics of human visual perception?
How to support GRC (Governance, Risk, Compliance) experts on identifying data inconsistencies, errors, and patterns considering key characteristics of human visual perception?
Final solution:
GRC Visual Analytics Platform.
GRC Visual Analytics Platform.
Related publications:
Santana et al., 2017. Multiple-perspective Visual Analytics for GRC Platforms. 19th International Conference on Enterprise Information Systems (ICEIS).*
Santana et al., 2017. Multiple-perspective Visual Analytics for GRC Platforms. 19th International Conference on Enterprise Information Systems (ICEIS).*
(*) Best paper nominee.
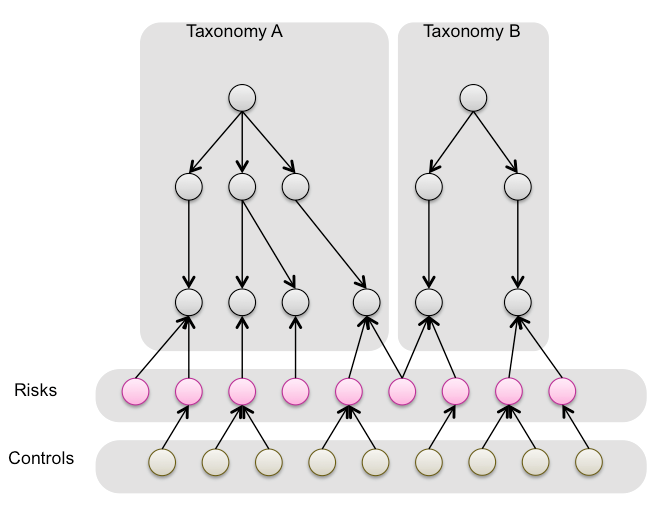
The data structure considered in multiple GRC systems involves multiple taxonomies and layers for risks and controls.

However, information visualizations for such data structure often focuses only on the risk layer.

Hence, the project aimed at exploring multiple perspectives around the GRC sparse graph data structure.

Among the proposed visualizations, one considered a combination of sunbursts visualizations for inherent risks, residual risks, and how risks changed after applying controls.

The Risk Map then explores risk rating changes and its connections with controls, supporting mainly where controls are adequate, effective and, specially, which risks are lacking controls.

And the Sankey diagram explores how the risks are connected to controls, controls' effectiveness, and how controls are reused in multiple risks.


A user test involving eye tracking was performed to evaluate which of the proposed visualizations were more effective for the tasks commonly performed by GRC experts. For more details about the study and technologies involved in the solution, please refer to the paper Multiple-perspective Visual Analytics for GRC Platforms.
Finally, the visual analytics GRC platform was delivered and connected to other two GRC systems already in use at the client.
With our system in place, the client was able to create detailed visual reports, large scale visualizations, identify data inconsistencies, and errors.
All of them exploring how the human vision perceives visual patterns.
